Chaikins Money Flow Analysis & Money Flow Signals
Conceived and Built by Marc Chaikin
This oscillator quantifies the net inflow and outflow of capital being directed into and withdrawn from indices.
The trading indicator works because the closer the final price is to the highest price, the more the indices are built up.
Furthermore, the closer the closing price sits relative to the low point of the prevailing market price, the greater the overall index distribution observed.
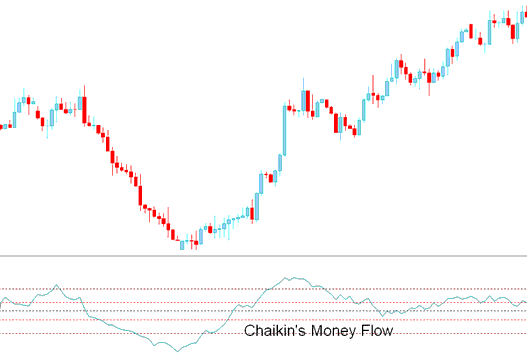
Chaikin Money Flow reflects positive values when market prices consistently close above the bar's midpoint in combination with rising trading volumes.
Nevertheless, if the price consistently closes beneath the midpoint of the bar with rising volume, the indicator will indicate a negative trend.
Index Analysis & How to Generate Signals
Buy Trading Signal
Crossing above zero signals an accumulation phase for indices. A reading exceeding +10 serves as a buy or bullish trading indicator, while levels above +20 denote a robust upward market trend.
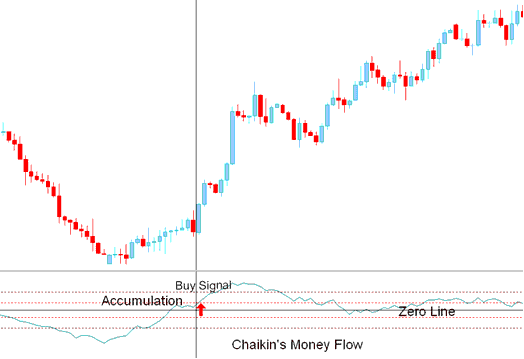
Buy Trading Signal
Sell Trade Signal
A zero line cross penetrating below zero signifies the distribution phase for indices. Any reading below -10 functions as a short or sell command, whereas readings falling under -20 signal the presence of a pronounced downward market trend.
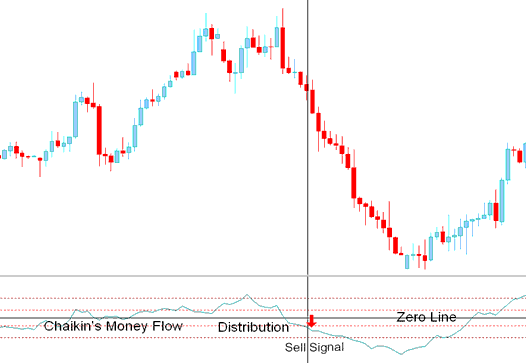
Sell Signal
Index Trend Line break with Chaikin’s money Flow
The money waft may be used to confirm trend-line breaks out or support/resistance area breaks out.
If the price goes below a rising trend-line, traders should then wait for the tool to show a confirming signal of below -10.
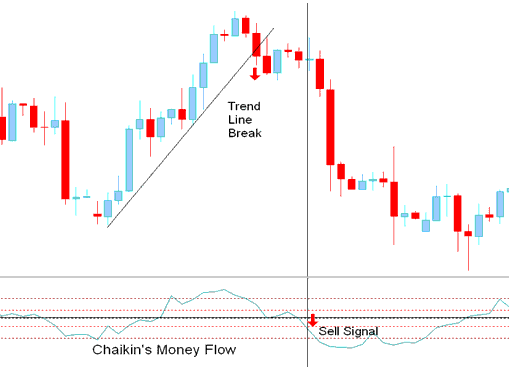
Index Trend-Line Break - Sell Trading Signal
If the price goes above a downward line, traders should wait for a confirmation signal from the indicator readings to be above +10.
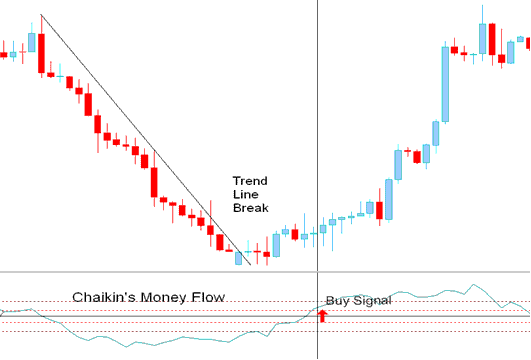
Index Trend Line Break - Buy Trading Signal
Divergence Trade
When this technical tool and the price don't match, it often means the market might change direction soon. But like with all mismatches, it's best to wait for a signal that says it's really happening before trading.
A bullish divergence signal occurs and happens when price makes a lower low while the Chaikins Money Flow makes a higher low.
A bearish divergence happens when the price goes up but the Chaikin Money Flow goes down some.
Study More Lessons:
- How to Place EU 50 in MetaTrader 5 EU 50 iPad App
- What are the Top 20 Stock Index Strategies?
- Types of Stock Index Traders and Their Scalping, Day Trading, and Swing Methods
- Darvas Box Index Indicator Analysis on Charts
- How to Trade US100 Lesson Guide Strategies List
- How to Add Relative Vigor Index, RVI Indicator on Index Chart