Chande Momentum Oscillator Indices Technical Analysis & Trading Signals
Developed by Tushar Chande
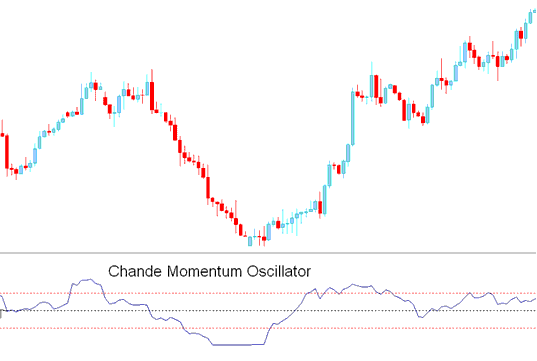
Chande Momentum Oscillator measures momentum of indices.
This Indicator uses a scale ranging between +100 & -100 thus allowing the trader to clearly see changes in net momentum using the 0 level mark as a balance point.
Calculation
Chande momentum uses data for both up days & down days in the numerator, thereby directly measuring momentum.
The calculations are performed on un smoothed data. This allows for short-term extreme market movements to be less hidden. However, smoothing can still be applied to the Oscillator.
Stock Indices Technical Analysis & How to Generate Signals
Buy Trading Signal
This Oscillator measures the momentum of indices price.
Levels above Zero line are considered to be bullish/buy stock indices signals.
The higher the indicator goes the higher the upward stock indices price momentum.
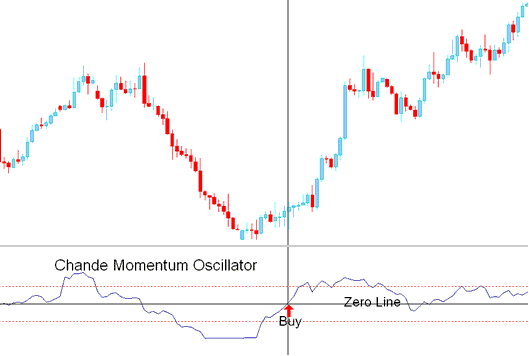
Buy Trading Signal
Sell Trading Signal
Levels below Zero line are considered to be bearish/buy stock indices signals.
The lower the indicator goes the higher the downward stock indices price momentum.
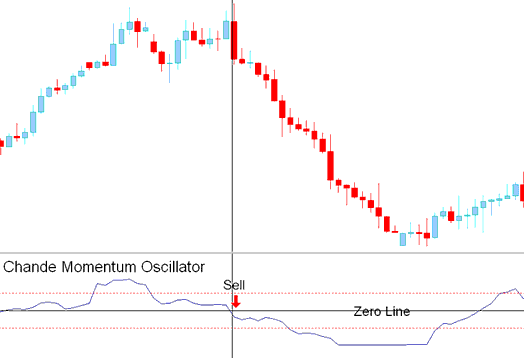
Sell Trading Signal


