Chande Trendscore: Stock Signals Guide
Conceived and Engineered by Tushar Chande
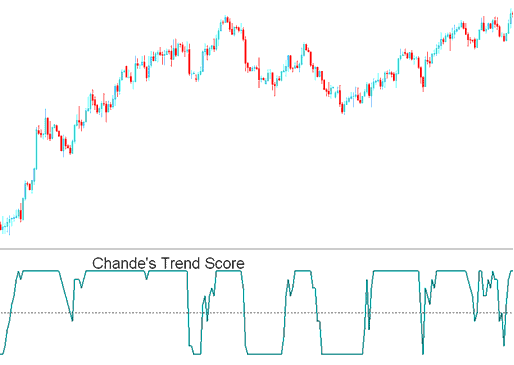
This indicator tries to figure out how strong a market trend is and which way it's going, by comparing the current price to the prices from the last 20 times the market closed.
The Chande Trendscore functions as an oscillator, fluctuating between the values of +10 and -10, with Zero serving as the central equilibrium point.
Chande Trendscore
Stock Analysis & How to Generate Signals
Buy Trading Signal
A value of above Zero indicate an upward trend of varying momentum
+10 Value Indicates a Strong Uptrend
Buy Signal
Sell Trading Signal
A value of below Zero shows a downwards trend of varying power
A figure of -10 shows the market is strongly trending downward.
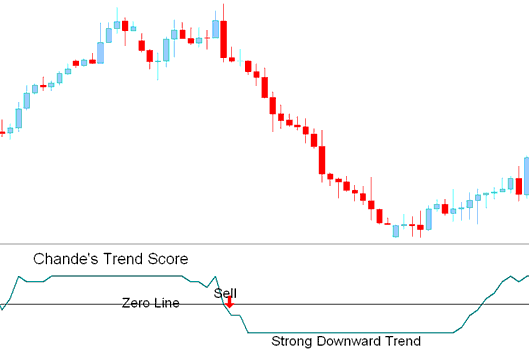
Sell Trade Signal
Learn More Guides:
- How Can I Add DAX in the MT5 iPad App?
- Index Trade Divergence Example
- Developing S&P 500 Trading Strategies: Course Lesson Overview
- What's FRA 40 1 PIP Point Change Equal to?
- Where to Find Index Trade Margin Levels in MT4 Software Platform
- Index Trade Tips for Successful Index Trade
- What is the Monetary Value of 1 Nano Lot in Index Trading?