
Upward Indices Trend Retracement Indicator Strategy
How Do I Draw Fibonacci Retracement for Stock Indices Uptrend?
The Fibonacci retracement indicator is placed on a stock indices chart in an upward indices trending market & this Fibo Retracement indicator then calculates the retracement levels for the upward trend on the stock indices charts. Fibonacci retracement levels stock indices indicator is used by many traders as a indices trading retracement trading indicator.
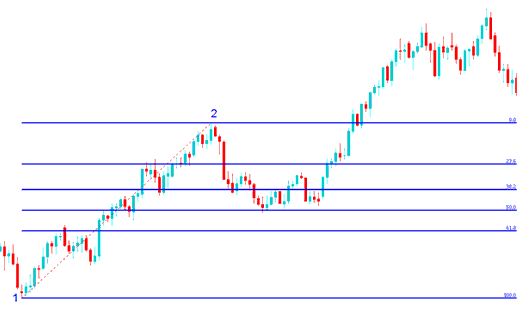
In the Indices Retracement Strategy Method example explained and illustrated below the stock indices price is moving up between chart point 1 and chart point 2 then after chart point 2 it retraces down to 50.0% retracement level then stock indices price continues moving up in the original upward trend. Note that this Fibonacci retracement technical indicator is plotted from point 1 to point 2 in direction of the trend (Upwards Direction).
Because we know this is just a retracement based on our chart indices trend - using this Fibonacci retracement indicator, we put a buy order just between the levels 38.2% and 50.0% retracement levels and our stop loss just below 61.8% retracement level. If you had put a buy at this point in the trade example explained and illustrated below you would have made a lot of pips after the stock indices price retracement reached the Fibonacci 50.0% level and then continued moving in the original upwards trend.
How to Trade Indices Price Retracement on Upwards Indices Trend - Fibo Retracement Levels Trading
Explanation for the Above Stock Indices Fibo Retracement Strategy Method Examples
Once the stock indices price hit the 50.0% Fibo retracement area, this retracement level provided a lot of support for the indices price, & afterward the stock indices market then resumed the original upward trend & continued to move upward.
23.60% Fibonacci retracement level provides minimum support and is not an ideal place to set a stock indices order.
38.2% Fibonacci retracement level provides some support but stock indices price in this example continued to retrace up to the 50 percent zone.
50.0% Fibo retracement level provides a lot of support & in this example, this was the ideal place to set a buy stock indices order.
For this Indices Retracement Strategy Method example, the stock indices price retracement reached the 50.0% Fibo retracement area, but most of the time the stock indices trading market will retrace up to 38.2% Fibo retracement level & therefore most of the time indices traders set their buy limit orders at the 38.2% Fibo retracement area, while at same time placing a stop just below 61.8% Fibo retracement level.