Stock Indices Day Trading Using Price Action Patterns Strategies
Stock Candle Patterns Lesson
The List of Stock Candle Patterns Course - Types of Stock Candle Patterns Example
The List of candlesticks price action patterns used to trade Indices - The top ten most often used indices candles price action patterns used to trade the market.
Stock Candle Patterns Illustrated/Explained with Examples
Doji is a indices candle pattern setup with same opening and closing price. There are various types of doji candlesticks pattern setup that form on charts.
following examples show various patterns of the doji candlestick:
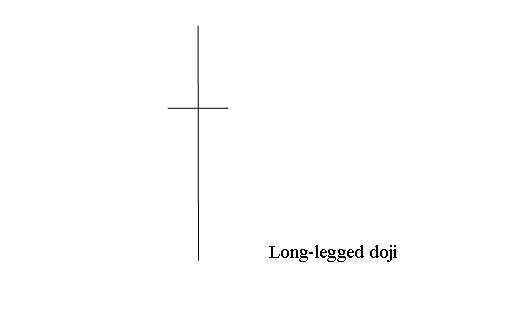
Long-legged doji day trading Candle Pattern Strategies has long upper and lower shadows with opening & closing price at the middle. When Long legged doji pops and shows up on Indices chart it shows indecision between the stocks traders, buyers & the sellers(bears).
Displayed Below is exemplification of Long Legged Doji trading candle pattern
Doji Stock Candle Pattern - Doji Intraday Strategy Using Price Action Trade Setups Course - Stock Candle Patterns Illustrated with Example
Doji Stock Candle Pattern - Doji Intraday Price Action Trading Setups Course
Stock Candle Patterns Illustrated/Explained with Examples
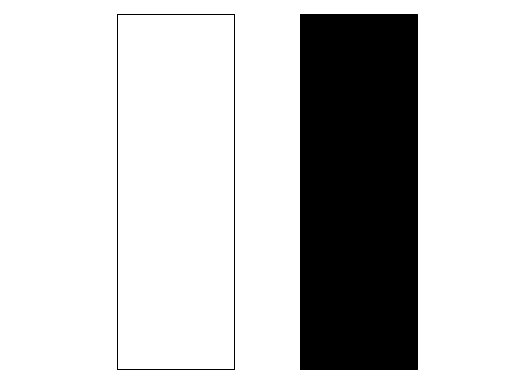
Marubozu Candlestick Strategies Pattern are long candlesticks that have no upper or lower shadows, Like illustrated below.
Stock Candle Patterns Illustrated with Example
Marubozu intraday trading Candle Pattern Strategies are continuing candle-stick patterns that show stock indices price is going to continue heading in the same direction as that of marubozu candle pattern. The marubozu candles setup pattern can be white/blue or black/red depending in the direction of the market price trend.
Stock Candle Patterns Illustrated/Explained with Examples
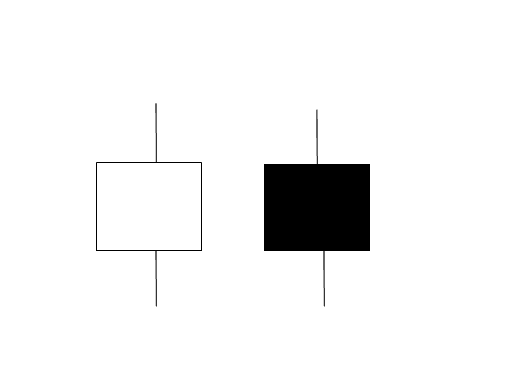
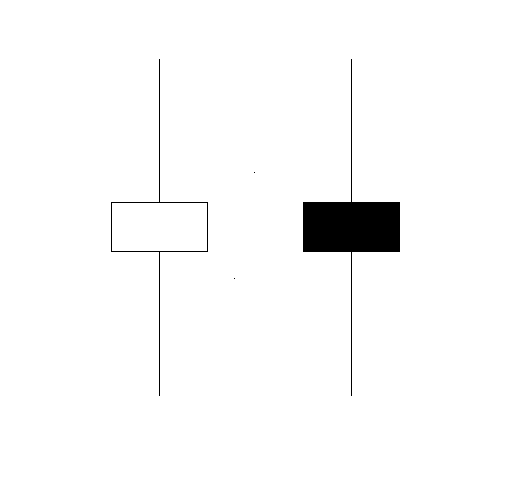
Spinning tops Candle Pattern have small body with a long upper & lower shadows. These spinning top indices candlesticks price action setup patterns are referred to and known by this term/name because these candlesticks arrangements are similar to the spinning top on a match-stick.
The upper and lower shadows of spinning top indices candlesticks setup pattern are longer than the body. The illustrations expounded below shows the spinning top indices day trading Candle Pattern Strategies. You can look for the pattern on your MT4 indices charts. The examples illustrated and shown below shows a screen shot to help traders when it comes to learning and understanding these day trading Stock Candle Pattern Strategies.
Stock Candle Patterns Illustrated with Example
Colour of the spinning top candle indices candlesticks pattern isn't important, this setup demonstrates indecision between buyers & sellers(bears) in Indices market. When these patterns appear at the top of a indices trend or at the bottom of trend it may signify the trend is coming to an end and it may soon reverse and begin going the other direction. However, it's best to wait for confirmation signal that direction of a indices instrument has reversed before taking the signal from this Candle Strategies Pattern formation.
Stock Candle Patterns Illustrated/Explained with Examples
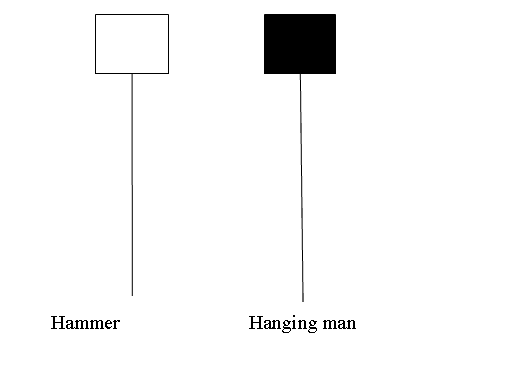
Hammer Candlestick Pattern & Hanging Man Candlestick Pattern candles look alike and similar but hammer is bullish market reversal indices day trading Candle Pattern Strategies and hanging man is a bearish market reversal stock Candlestick Price Action Trade Setup.
Stock Candle Patterns Illustrated with Example
Stock Candle Patterns Illustrated/Explained with Examples
Hammer Candlestick Pattern is a potentially bullish candle pattern setup which forms during a indices downwards trend. It's named and called so because the market is hammering out a bottom.
Stock Candle Patterns Illustrated/Explained with Examples
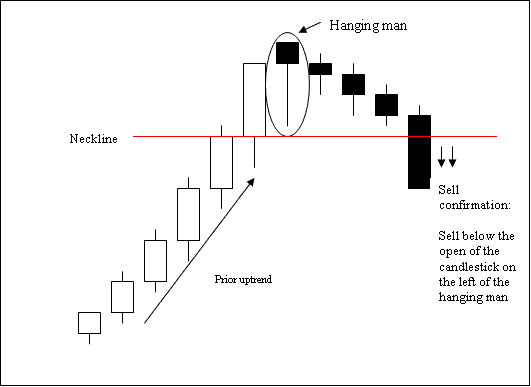
This hanging man day trading Candle Pattern Strategies is a potentially bearish indices reversal which happens during a indices upward trend. It is named and called so because it resembles a man hanging on a noose up high.
Stock Candle Patterns Illustrated with Example
Stock Candle Patterns Illustrated/Explained with Examples
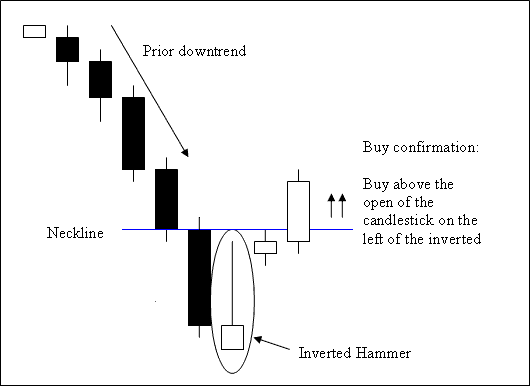
This is a bullish market reversal day trading Stock Candle Pattern Strategies. It forms at the bottom of a Stock Index trend.
Inverted hammer Indices Candle Pattern forms at the bottom of a downward trend and reflects the possibility of market price reversal of the downward trend.
Stock Candle Patterns Illustrated with Example
Stock Candle Patterns Illustrated/Explained with Examples
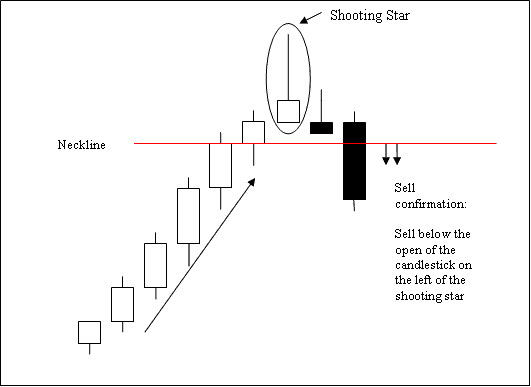
Shooting Star Candlestick is a bearish market reversal stock Candlestick Price Action Trade Setup. It forms at the top of a indices trend.
Shooting Star Candlestick Pattern occur at top of an upward indices trend in the Stock Index Trade market where the open price is same as the low and indices price then rallied upward but was forced back downwards to close the open.
Shooting Star Candle - Stock Candle Patterns Illustrated with Example
Stock Candle Patterns Illustrated/Explained with Examples
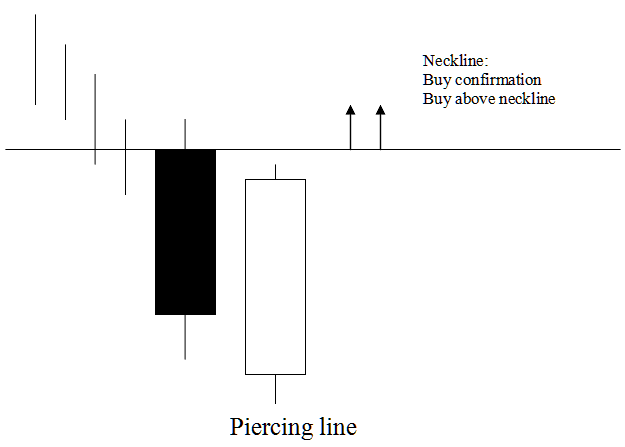
Piercing line candle setup pattern is a long black body followed by long white body candlestick.
The white body pierces the mid point of previous black body.
This Piercing Line intraday trading Candle Pattern Strategies is a bullish market reversal day trading Candle Pattern Strategies which occurs at the bottom of a market downwards trend. It shows that the market opens lower & closes above midpoint of the black body.
This Piercing Line Candle Strategies Pattern shows that the energy of the downward indices trend is reducing/decreasing and indices market trend is likely to reverse move in an upward direction.
This Piercing Line day trading Candle Pattern Strategies is shown are known as a piercing line signifying and signaling that the market is piercing the bottom signifying a market floor for stock indices price downwards trend.
Stock Candle Patterns Illustrated with Example
Indices Candle Patterns Illustrated/Explained with Examples
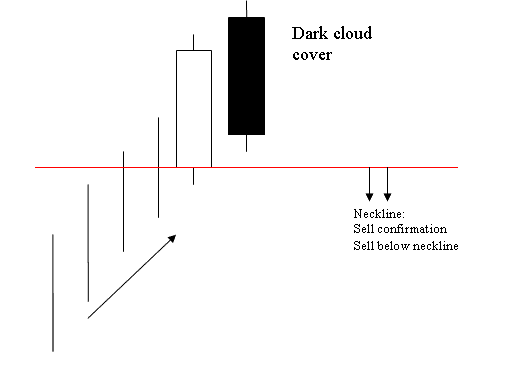
Opposite of piercing candle candlestick.
This candlestick is a long white body followed by a long black body.
The black body pierces the mid point of the prior white body.
This is a bearish market reversal setup which forms at the top of an upwards trend.
Dark Cloud Indices Candle Pattern that the market opens higher & closes below midpoint of the white body.
Dark Cloud stock indices day trading Candle Pattern Strategies shows that the energy of the upwards trend is reducing/decreasing and indices market trend is likely to reverse & move in a downward trade direction.
Dark Cloud stock indices day trading Candle Pattern Strategies is shown are referred to as a cloud cover signifying the cloud as a ceiling for price upward trend.
Dark Cloud Stock Candle Pattern - Indices Day Trading Methods Using Price Action Trade Setups Lesson Guide
Stock Candle Patterns Illustrated/Explained with Examples
Stock Candle Patterns Illustrated with Example
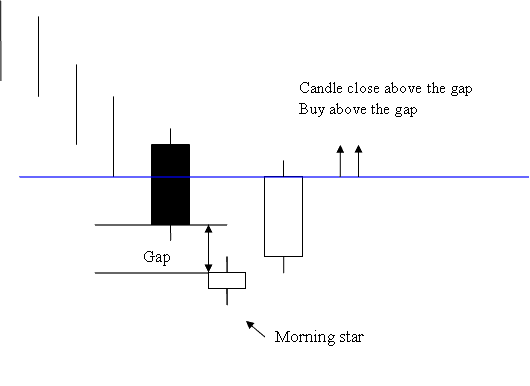
Stock Candle Patterns Illustrated/Explained with Examples
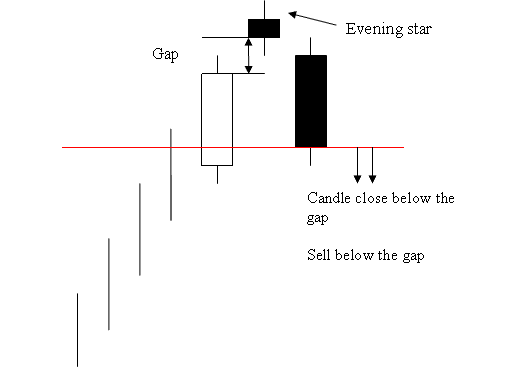
Opposite of morning star stock indices candlesticks pattern
Stock Candle Patterns Illustrated with Example
Stock Candle Patterns Illustrated/Explained with Examples
Engulfing is a reversal intraday trading Candle Pattern Strategies that can be bearish or bullish depending upon whether it occurs at the end of a indices market downward indices trend or at the end of a indices market upward trend.
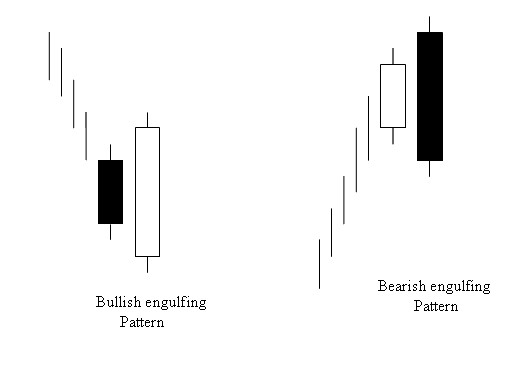
Stock Candle Patterns Illustrated with Example
Get More Tutorials & Courses:
- How Can I Draw Stock Index Trend lines Bounce Analysis?
- Which is the Best Indices Broker for Cent Indices Account for Stock Index Beginners?
- What are Reversal Setups?
- How to Add Fib Pullback Levels on Charts
- What are the 3 Types of Indices Charts?
- DAX MT4 DAX Software/Platform
- Stock Index Concept of Support and Resistance Levels to Trade Stock Indices
- What's the Difference Between Stock Indices Cent and Mini Indices Account?
- Download Index MT4 for Android


