Inertia Indices Technical Analysis & Inertia Signals
Donald Dorsey made it, and it was first used for trading Stocks and Commodities, before traders used it for trading the market with this technical tool.
Dorsey decided to call it "Inertia" because of how he understood the trend. He said that a market trend happens because of inertia, so it takes more effort to change a trending market's direction than to keep it going the same way. So, a market trend shows how much inertia the market has. This is a tool that moves between zero and one hundred. Signals are made by using the method of crossing the 50 level in the middle.
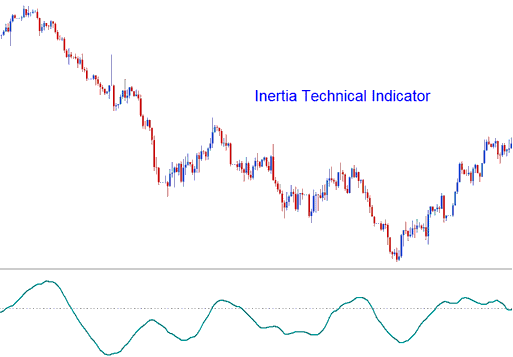
In science, inertia is about how heavy something is and what direction it's moving. If we look at it normally, it's easy to see which way the trend is going. But, it's not easy to measure the weight. Dorsey said that how much a trading thing changes could be the easiest and best way to measure inertia. This idea led to using the Relative Volatility Index, or RVI, as a basic way to see market trends. So, the Inertia indicator is made up of the RVI, smoothed out with a line.
Index Technical Analysis and How to Generate Signals
In the market using this indicator, the signals generated are fairly simple to interpret. Below are 2 example illustrated using charts showing how buy and sell signals are derived & generated using Inertia.
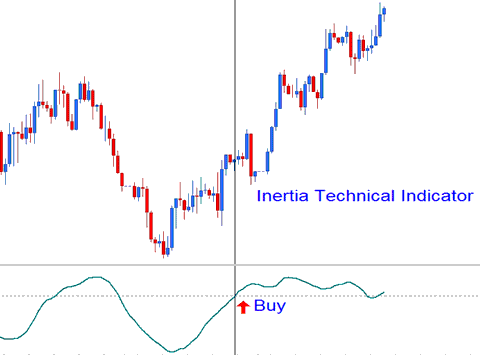
Bullish Buy Signal
A reading above 50 on the Inertia indicator suggests positive momentum, thereby indicating that the long-term trend is upward as long as this technical indicator stays above that level. If the value dips below 50, it signals a potential exit from the trade. The example chart below illustrates how a buy signal for a stock is produced.
Bullish Trading Signal
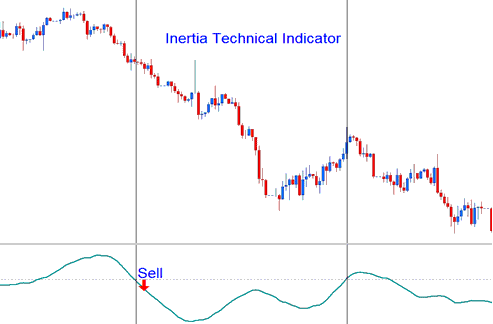
Bearish Sell Signal
If the Inertia is below 50, negative inertia is indicated, this thence defines the long term trend as downwards as long as the trading technical indicator remains below 50. If it crosses above 50 this then is interpreted as an exit trading signal. The chart below shows how a sell signal generated.
Bearish Signal
Study More Lessons:
- How Can I Find DJ30 in MetaTrader 4 App?
- Characteristics of the Three Major Stock Index Trade Market Sessions
- Where Do Find NETH 25 on MT4 Software Platform?
- How Can I Add WallStreet 30 in MT5 Android Phone App?
- Where Can Find NKY 225 on MT5 Platform?
- What is the Indices Margin Requirement for 1:100 Index Leverage?
- How Can I Add SX5E in MT5 iPhone Trade App?
- How to Interpret a New Indices Order on MetaTrader 5 Android App
- SPX IND: SPX Index
