Drawing Line Stock Indices Charts in MT4
This is the fifth option on the charts menu within the MT4 platform. The line stock indices chart button shown below.
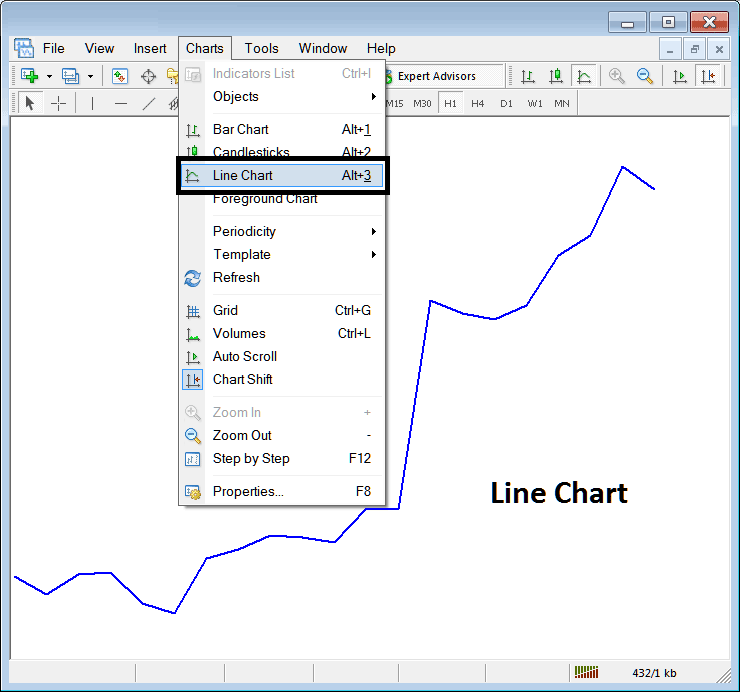
The line stock indices charts are not popular and are not used by many traders as these do not show a lot of information that is useful for technical analysis. This option will only draw a indices trading price line that connects the closing stock indices trading prices leaving out all other data.
When compared to candlesticks that will show the Opening, the Closing, the Low and the High of indices trading price, then the line stock indices chart leaves out a lot of information in its graphical representation of market movement.
Most of this data is useful & used by most traders when using technical analysis technique therefore the candles are preferred because they provide more data for technical analysis.
For this reason this charting method isn't popular among technical traders & therefore not widely used.


